


 1 мин. чтения


Nasdaq-100: ⬆️ Buy
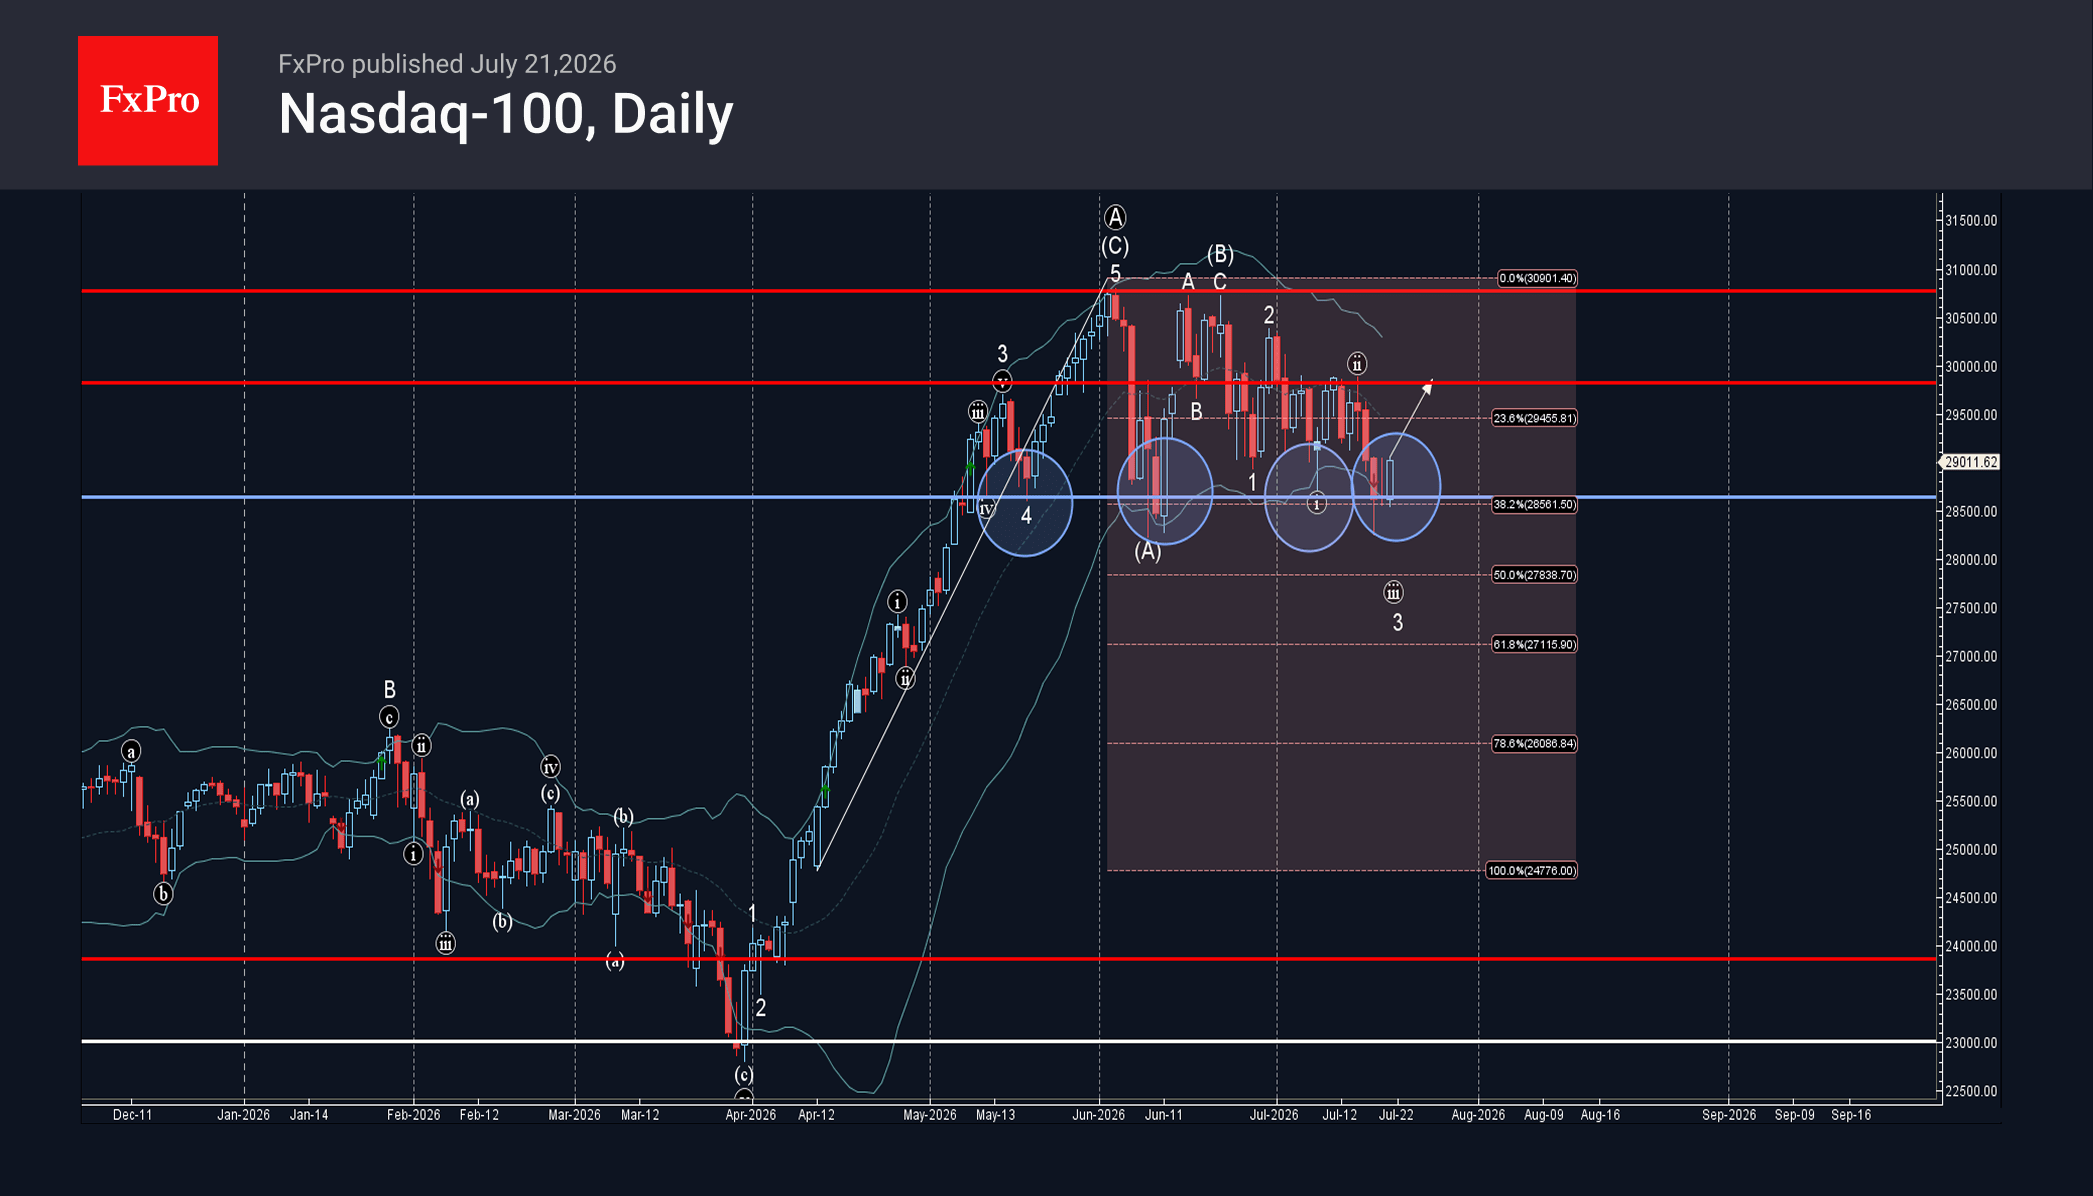
– Nasdaq-100 reversed from support zone
– Likely to rise to resistance level 29815.00
Nasdaq-100 index recently reversed from the support zone between the support level 28630.00 (which has been reversing the index from May), lower daily Bollinger Band and the 38.2% Fibonacci correction of the upward impulse from April.
The upward reversal from the support level 28630.00 stopped the earlier minor impulse wave 3.

Given the strong daily uptrend, Nasdaq-100 index can be expected to rise to the next resistance level 29815.00 (top of the previous wave ii).
Source: https://fxpro.news
